load library and datasets
library(DOSE)
library(tidyverse)
library(org.Hs.eg.db)
library(clusterProfiler)
library(DT)
library(msigdbr)
get ranks of genes
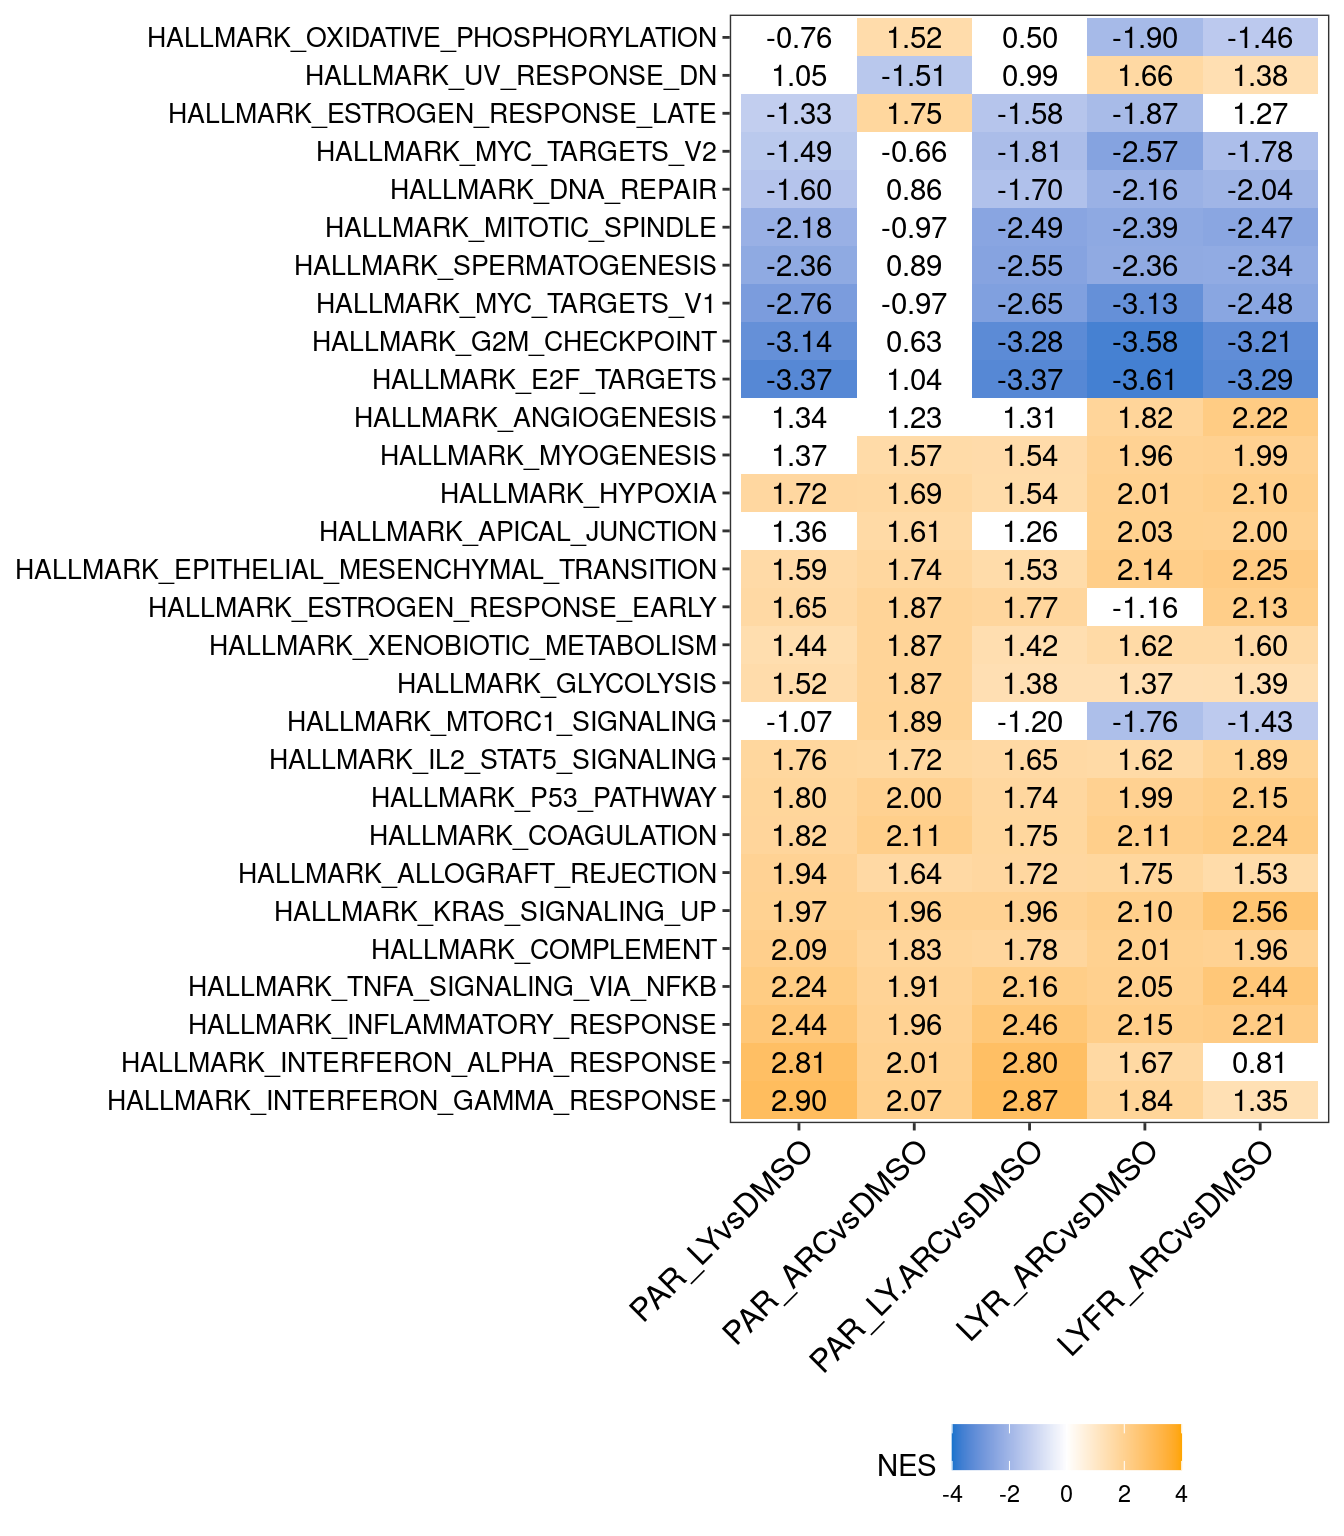
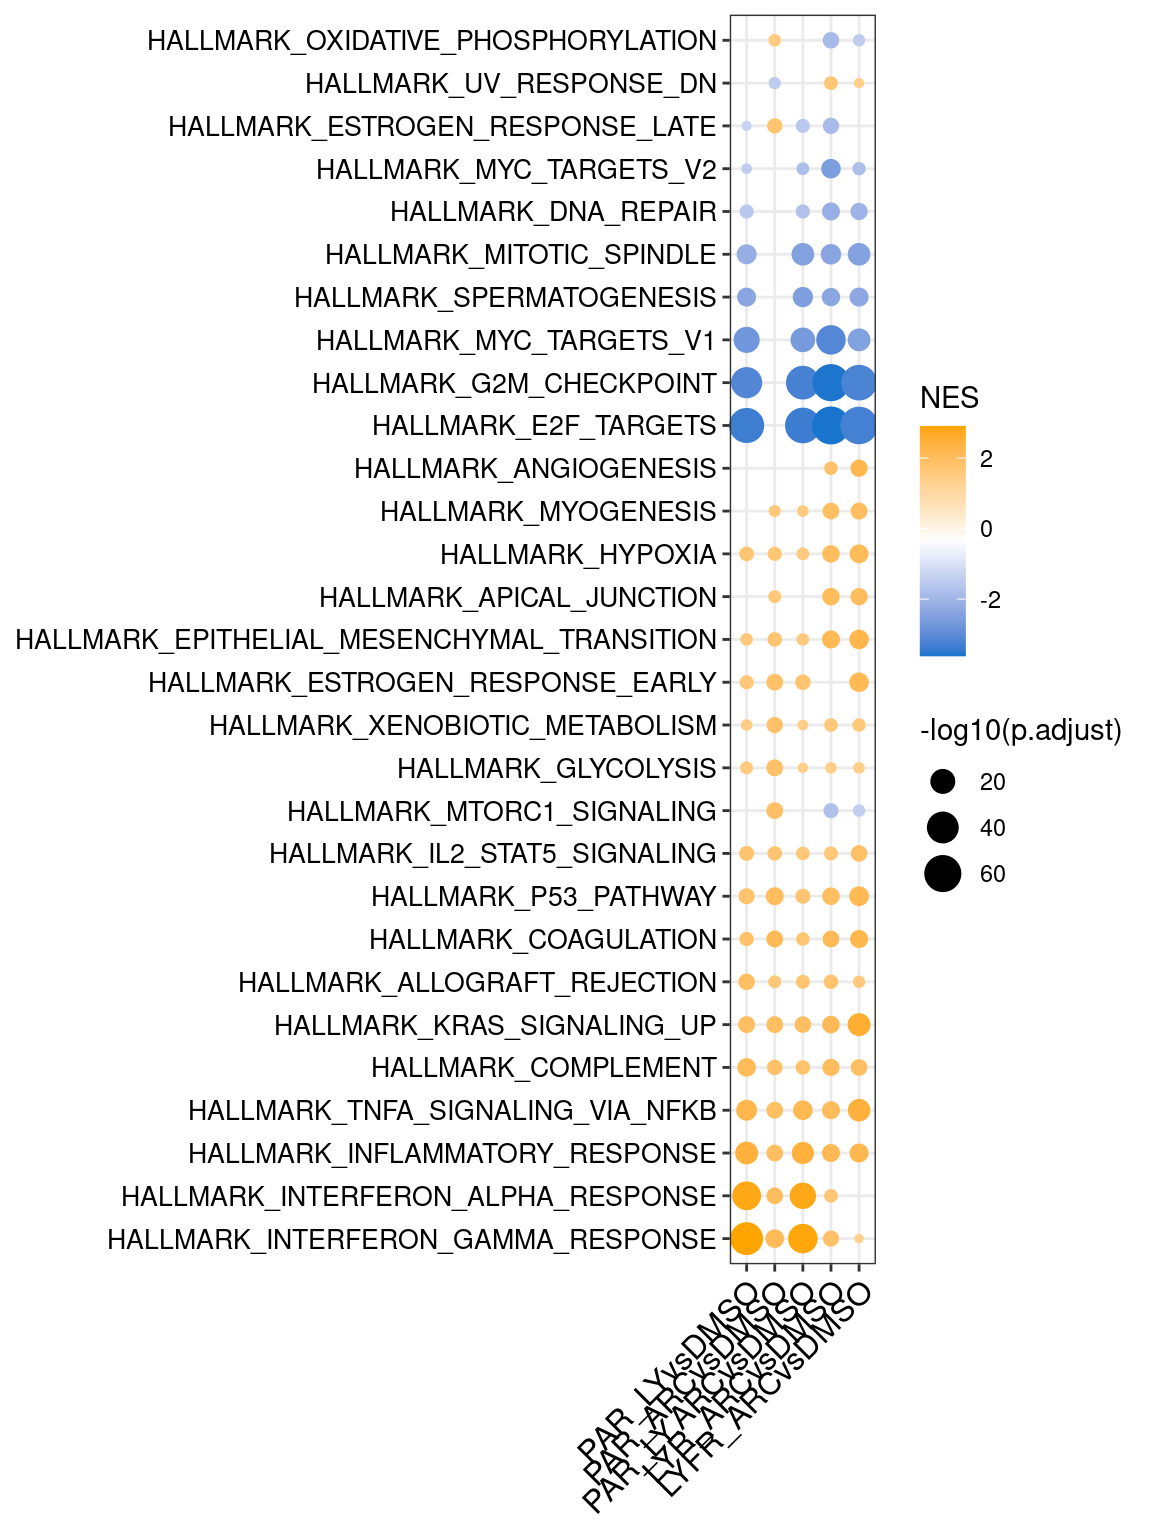
# there are 5 comparisons. This dataset is from "Dietrich C, Trub A. INX-315, a selective CDK2 inhibitor, induces cell cycle arrest and senescence in solid tumors. Cancer Discov. 2023 Dec 4"
DE_list %>% names
## [1] "PAR_LYvsDMSO"     "PAR_ARCvsDMSO"    "PAR_LY.ARCvsDMSO" "LYR_ARCvsDMSO"
## [5] "LYFR_ARCvsDMSO"

## $PAR_LYvsDMSO
##   A1BG-AS1     A4GALT       AAAS       AACS      AAGAB       AAK1
## -0.9150194  0.2292568 -0.5303841 -0.2728154 -0.2673752  1.1438151
##
## $PAR_ARCvsDMSO
##    A1BG-AS1      A4GALT        AAAS        AACS       AAGAB        AAK1
## -0.33311195  0.12477299 -0.09373685 -0.11442974 -0.18108505  0.44105658
##
## $PAR_LY.ARCvsDMSO
##    A1BG-AS1      A4GALT        AAAS        AACS       AAGAB        AAK1
## -0.57935270  0.12057293 -1.02542265 -0.02503685  0.03875984  0.84889094
##
## $LYR_ARCvsDMSO
##   A1BG-AS1     A4GALT       AAAS       AACS      AAGAB       AAK1
## -0.1221634  0.2373029 -0.0791930 -0.1793278 -0.5279337  0.9647828
##
## $LYFR_ARCvsDMSO
##   A1BG-AS1     A4GALT       AAAS       AACS      AAGAB       AAK1
##  0.1851126  0.4573528 -0.3331115  0.2801182 -0.1870958  1.2414269
# %>% filter(padj < 0.2) %>%  arrange(desc(NES))
gsea_df$PAR_LYvsDMSO %>% datatable(caption = "PAR_LYvsDMSO")
gsea_df$PAR_ARCvsDMSO %>% datatable(caption="PAR_ARCvsDMSO")
gsea_df$PAR_LY.ARCvsDMSO %>% datatable(caption = "PAR_LY.ARCvsDMSO")
## Warning: Removed 22 rows containing missing values (`geom_point()`).
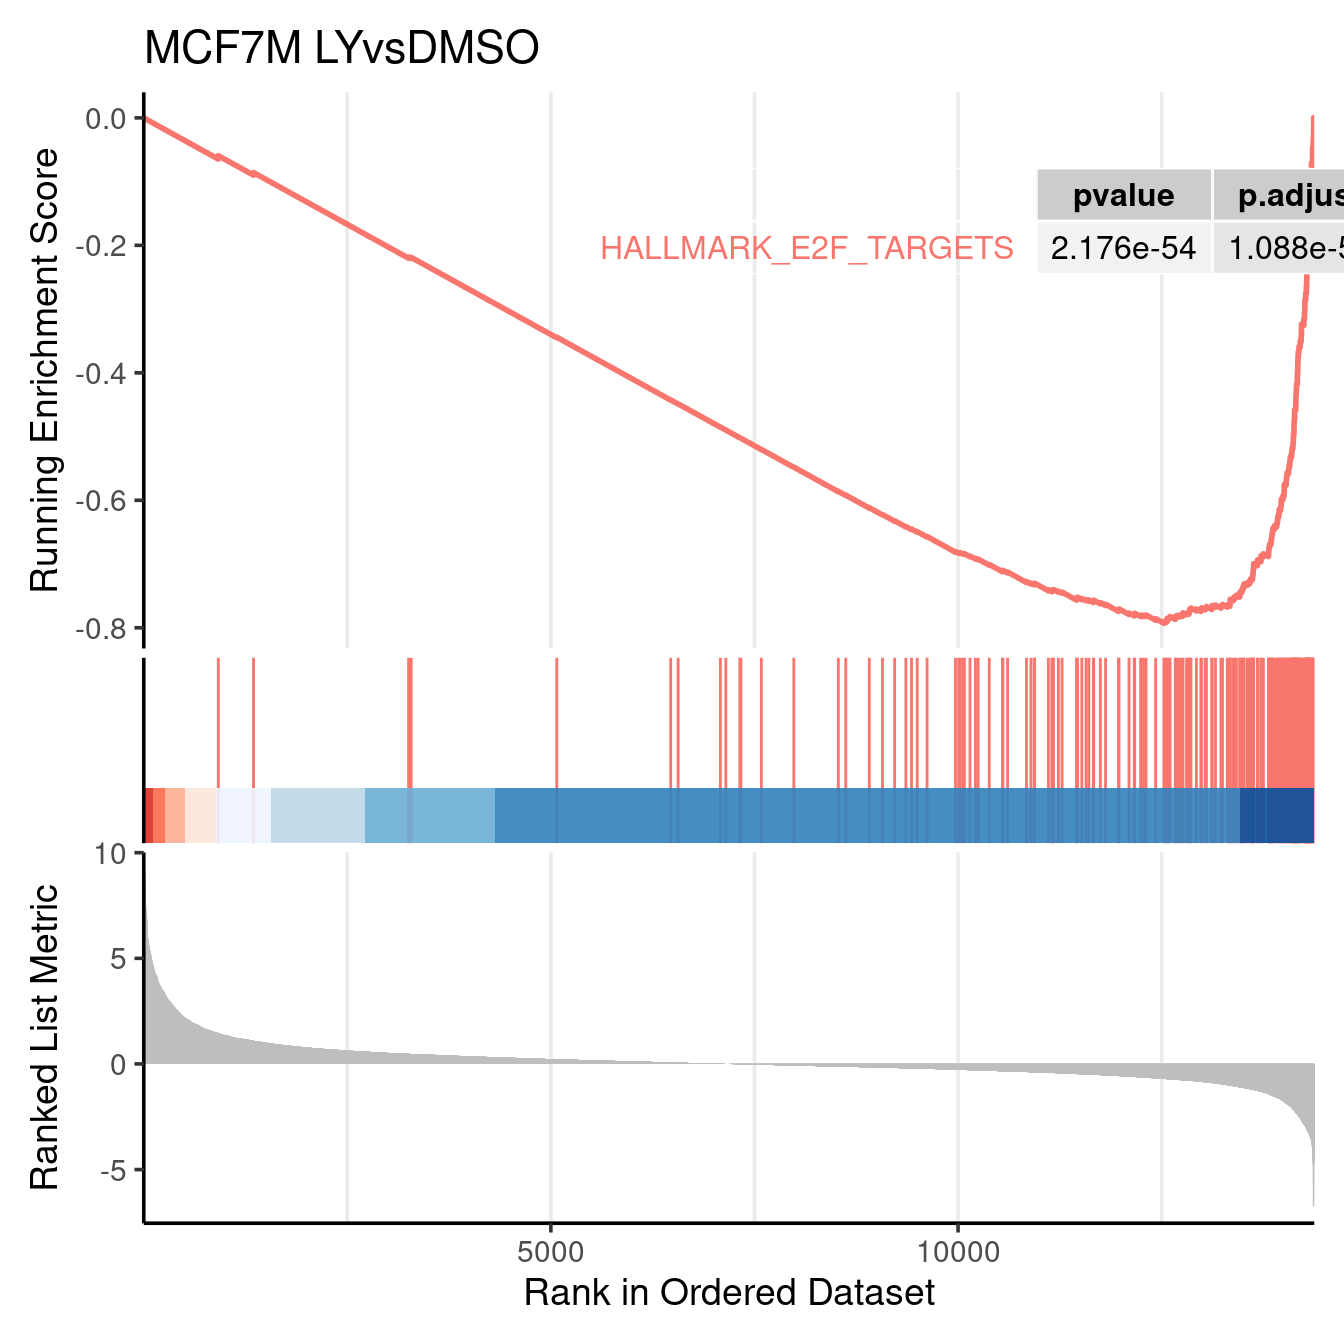
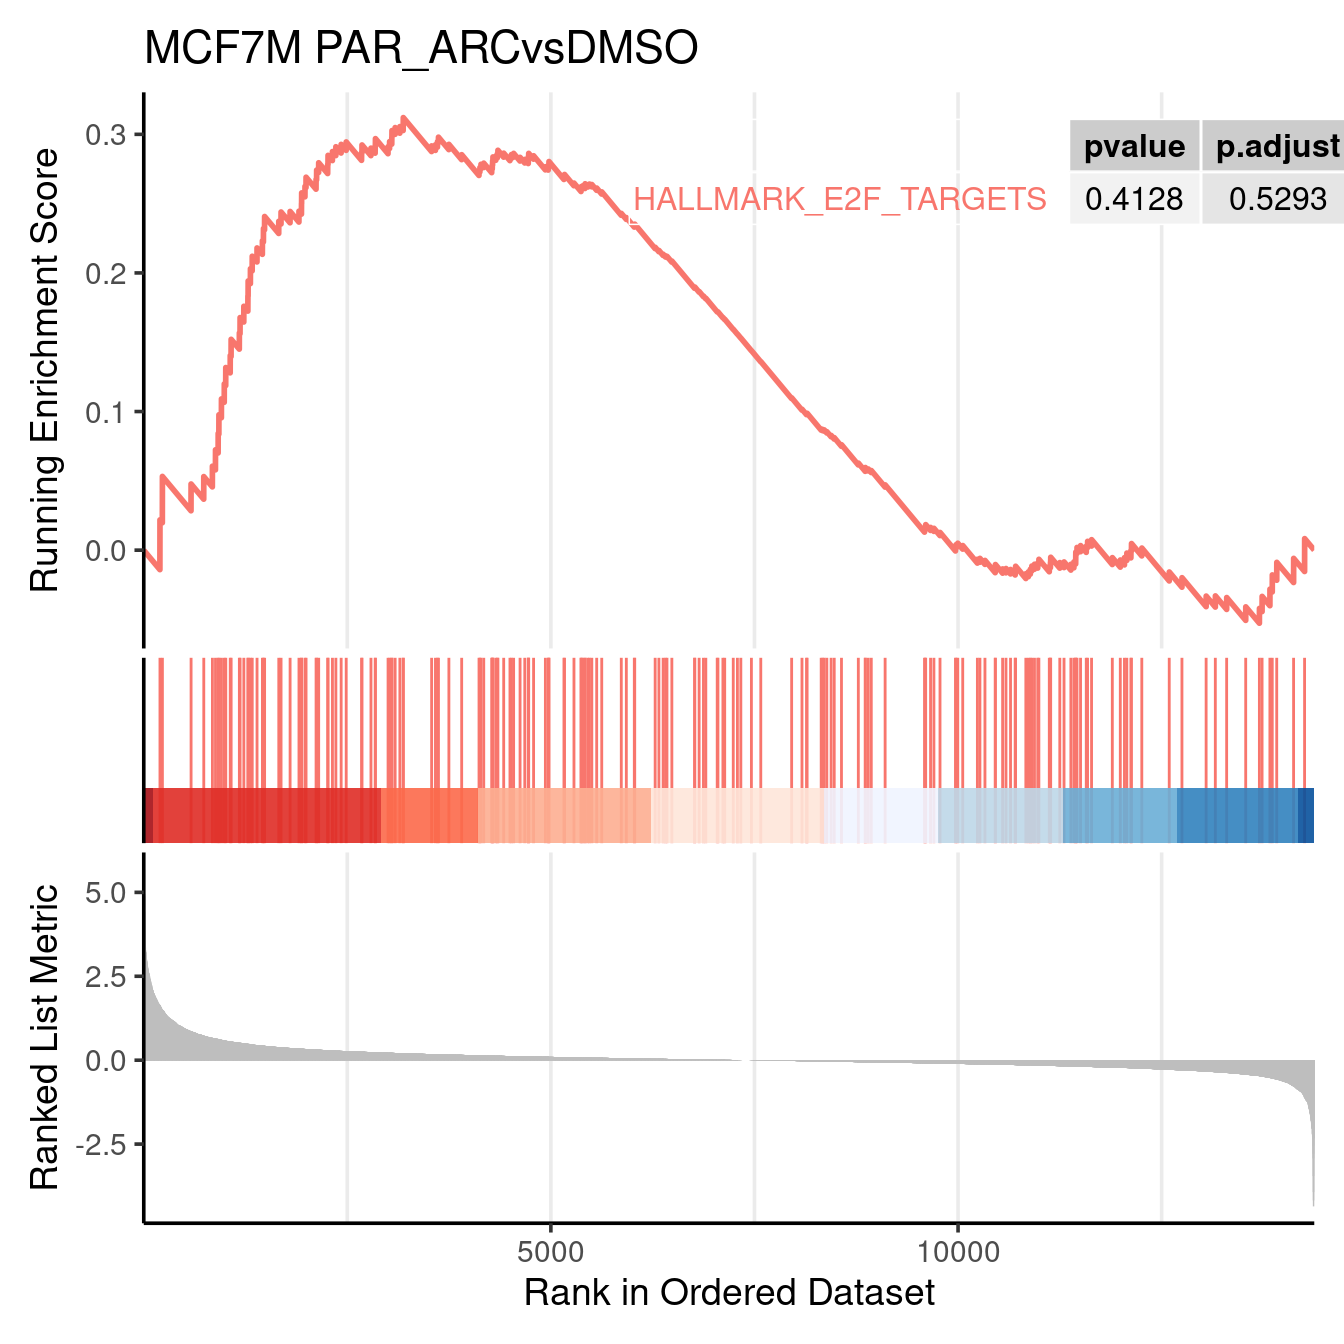
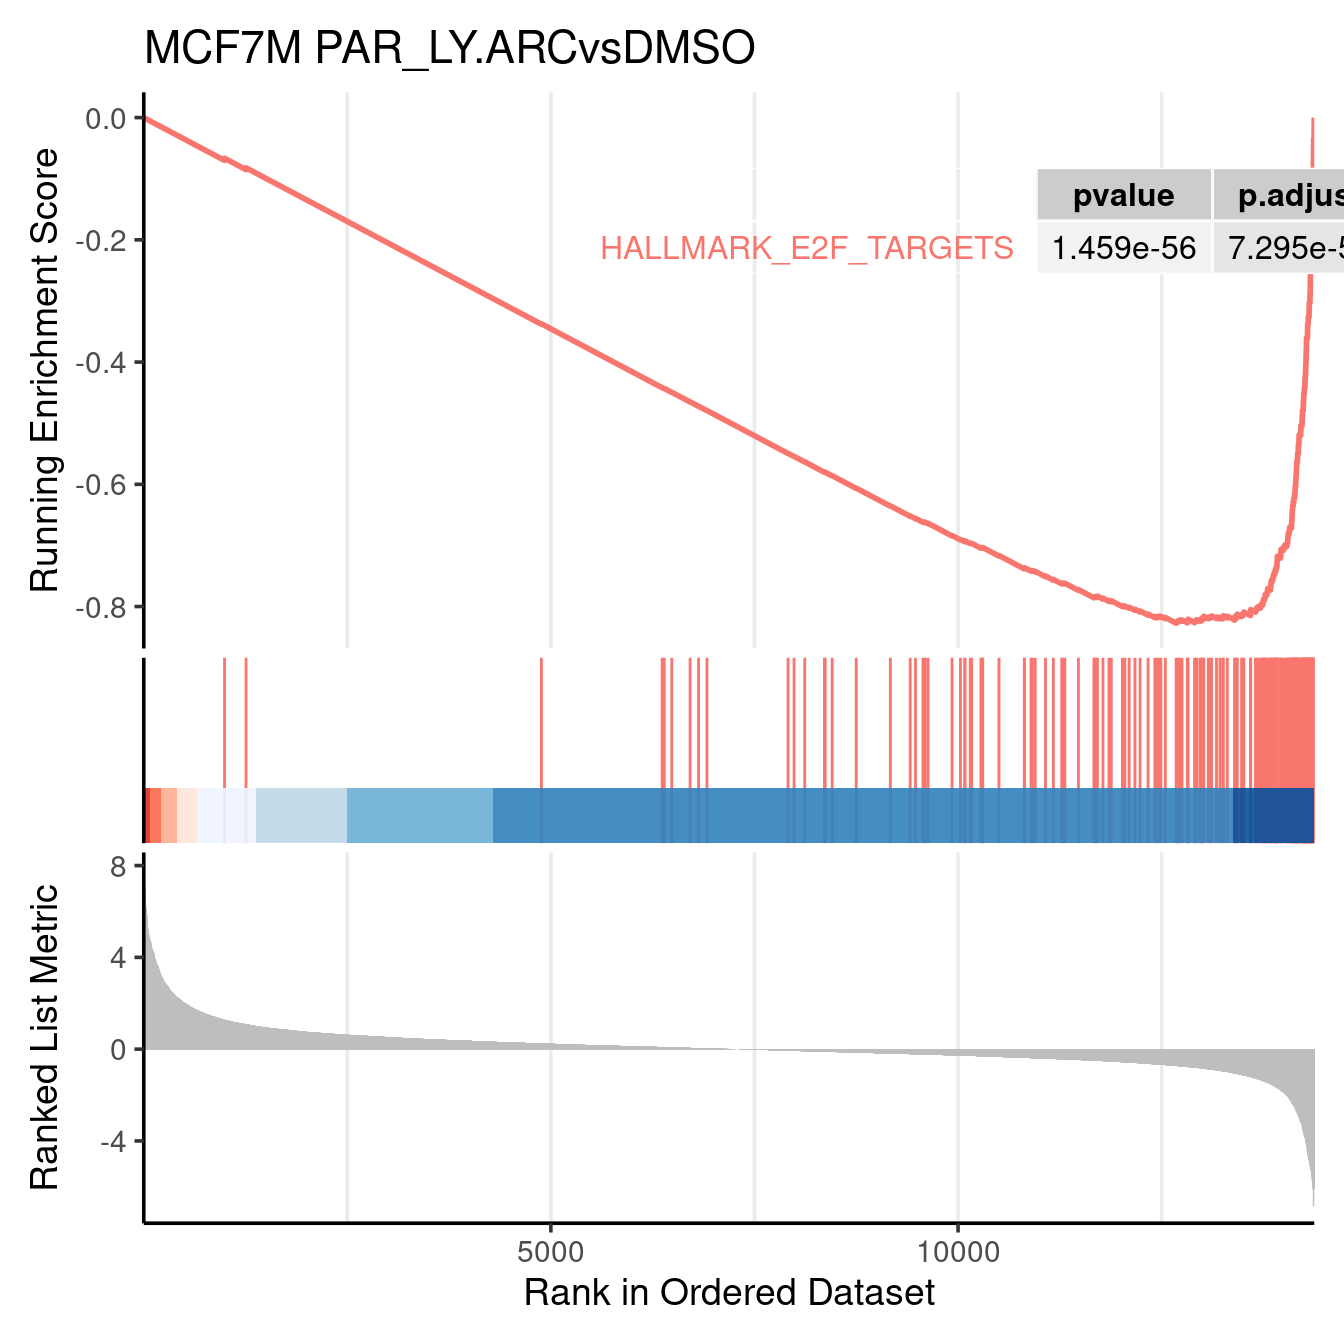
barcode plots
library(clusterProfiler)
library(enrichplot)
gseaplot2(gsea_output$PAR_LYvsDMSO, geneSetID = c("HALLMARK_E2F_TARGETS"), title = "MCF7M LYvsDMSO", color = c("#E495A5", "#86B875"), pvalue_table = TRUE, base_size = 14)
gseaplot2(gsea_output$PAR_ARCvsDMSO, geneSetID = c("HALLMARK_E2F_TARGETS"), title = "MCF7M PAR_ARCvsDMSO", color = c("#E495A5", "#86B875"), pvalue_table = TRUE, base_size = 14)
gseaplot2(gsea_output$PAR_LY.ARCvsDMSO, geneSetID = c("HALLMARK_E2F_TARGETS"), title = "MCF7M PAR_LY.ARCvsDMSO", color = c("#E495A5", "#86B875"), pvalue_table = TRUE, base_size = 14)