library(ComplexHeatmap)
library(tidyverse)
library(pheatmap)
library(circlize)
ComplexHeatmap
generate matrix (from https://jokergoo.github.io/ComplexHeatmap-reference/book/a-single-heatmap.html)
set.seed(123)
nr1 <- 4
nr2 <- 8
nr3 <- 6
nr <- nr1 + nr2 + nr3
nc1 <- 6
nc2 <- 8
nc3 <- 10
nc <- nc1 + nc2 + nc3
mat <- cbind(
  rbind(
    matrix(rnorm(nr1 * nc1, mean = 1, sd = 0.5), nr = nr1),
    matrix(rnorm(nr2 * nc1, mean = 0, sd = 0.5), nr = nr2),
    matrix(rnorm(nr3 * nc1, mean = 0, sd = 0.5), nr = nr3)
  ),
  rbind(
    matrix(rnorm(nr1 * nc2, mean = 0, sd = 0.5), nr = nr1),
    matrix(rnorm(nr2 * nc2, mean = 1, sd = 0.5), nr = nr2),
    matrix(rnorm(nr3 * nc2, mean = 0, sd = 0.5), nr = nr3)
  ),
  rbind(
    matrix(rnorm(nr1 * nc3, mean = 0.5, sd = 0.5), nr = nr1),
    matrix(rnorm(nr2 * nc3, mean = 0.5, sd = 0.5), nr = nr2),
    matrix(rnorm(nr3 * nc3, mean = 1, sd = 0.5), nr = nr3)
  )
)
# color range
color_bar_range <- max(abs(min(mat)), abs(max(mat)))
col.pan <- colorRamp2(c(-color_bar_range, -color_bar_range + 2, 0, color_bar_range - 2, color_bar_range), c("black", "dodgerblue3", "white", "orange", "red"))
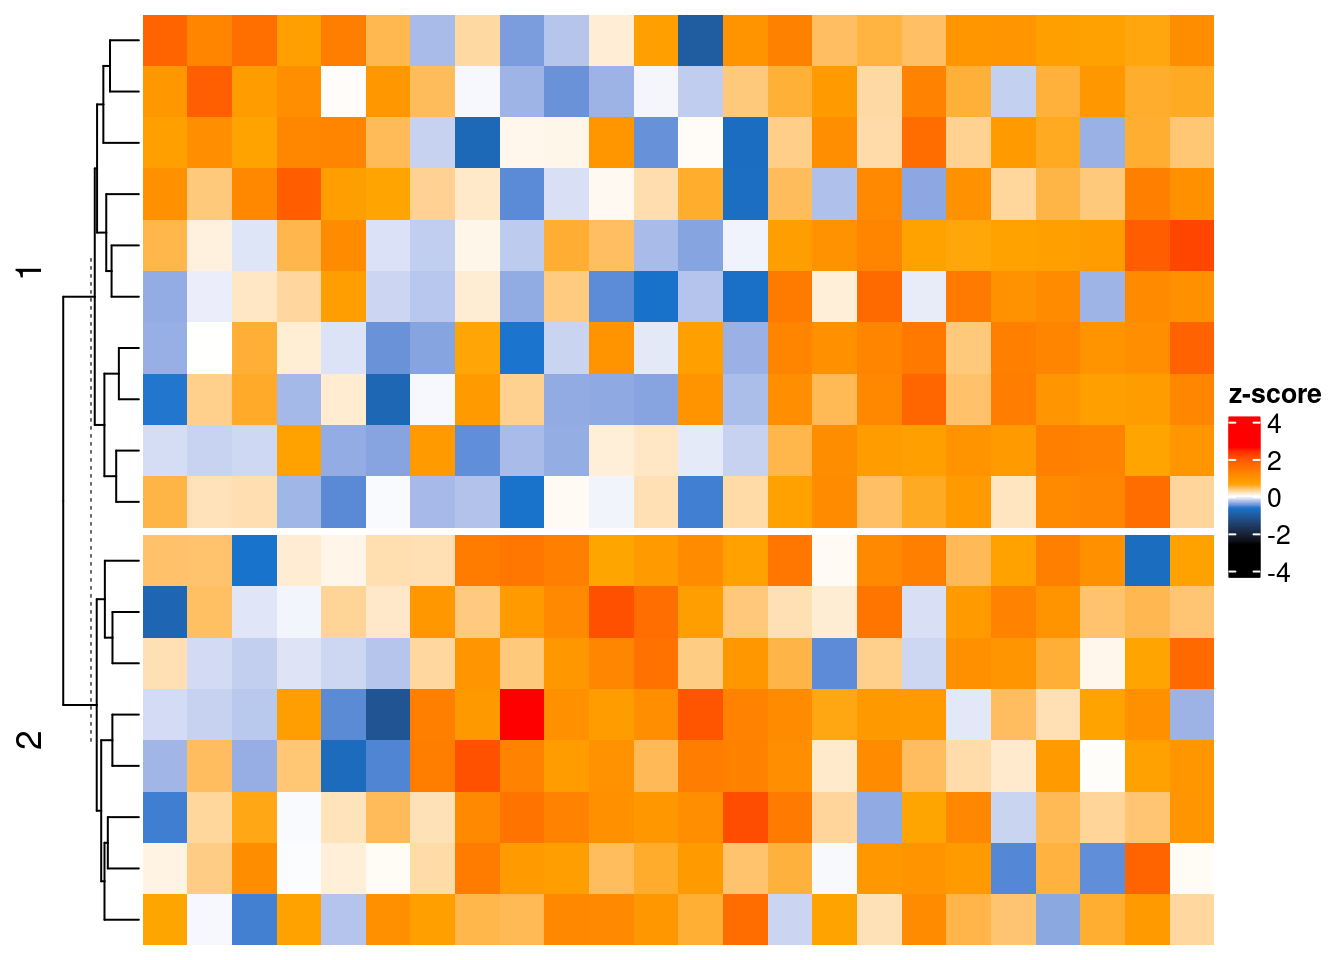
Heatmap(mat,
name = "z-score",
col = col.pan,
# top_annotation = column_ha,
cluster_columns = FALSE,
row_km = 2, show_row_names = TRUE, row_names_gp = gpar(fontsize = 7)
)
example function
genes_input <- filter(h_gene_sets, gs_name == "HALLMARK_E2F_TARGETS")$gene_symbol


make_heatmap_symbol_CHM <- function(genes_input,
                                    turnon_rownames = FALSE, rownames_size = 7,
                                    turnon_clusterrows = TRUE, show_barplot = FALSE,
                                    kmeansrows_number = 1) {
  # only get the genes that interesct between genes_input and the genes in the normalised matrix
  genes_input <- intersect(genes_input, rownames(norm_mat_symbol))
  heatmap_mat <- norm_mat_symbol[genes_input, ]
  # take out any rows with all zero's in the rows. This sometimes happens because when i only select out the PAR group, all zeros but its in the matrix because in the LYFR it is expressed. These are quite interesting... SASP genes that are not expressed at PAR but only expressed in LYFR. I wonder if these are expressed at PAR treated with LY + Fulv. shouldn't be? cuz Fulv brings most things down ...
  index <- apply(heatmap_mat, 1, function(row) all(row == 0))
  heatmap_mat <- heatmap_mat[!index, ]
  # generate z-score
  scaled.mat <- t(scale(t(heatmap_mat)))
  ##### ----------------------------------------------------------------------------------------------------
  # column colors
  column_color_treatment <- col_npg5[1:4]
  # column_color_time <- ggsci::pal_simpsons()(8)[1:8]

  names(column_color_treatment) <- unique(sample_information$treatment)
  # names(column_color_time) <- unique(sample_information$time)

  anno_colors <- list(treatment = column_color_treatment)
  # time = column_color_time)
  # column annotations
  column_ha <- HeatmapAnnotation(
    mean = anno_barplot(colMeans(scaled.mat), height = unit(2, "cm")),
    treatment = sample_information$treatment,
    # time = sample_information$time,
    col = anno_colors
  )
  # column split
  column_split <- sample_information$treatment
  ##### ----------------------------------------------------------------------------------------------------
  # cell colors
  # col.pan <-  colorRampPalette(c("black","dodgerblue3", "white", "orange","red"))(100)
  # color range
  color_bar_range <- max(abs(min(scaled.mat)), abs(max(scaled.mat)))
  # ceiling rounds up (to integer)
  color_bar_range <- ceiling(color_bar_range)
  col.pan <- colorRamp2(c(-color_bar_range, -color_bar_range + 2, 0, color_bar_range - 2, color_bar_range), c("black", "dodgerblue3", "white", "orange", "red"))
  ##### ----------------------------------------------------------------------------------------------------
  # color range
  color_bar_range <- max(abs(min(scaled.mat)), abs(max(scaled.mat)))
  # ceiling rounds up (to integer)
  color_bar_range <- ceiling(color_bar_range)
  ##### ----------------------------------------------------------------------------------------------------
  # make heatmap
  Heatmap(scaled.mat,
    name = "z-score",
    col = col.pan,
    top_annotation = column_ha,
    cluster_columns = FALSE,
    row_km = kmeansrows_number, show_row_names = turnon_rownames, row_names_gp = gpar(fontsize = rownames_size),
    column_split = sample_information$treatment
  )
}
# heatmap_legend_param = list(at = c(-5, 0, 5)
make_heatmap_symbol_CHM(filter(h_gene_sets, gs_name == "HALLMARK_E2F_TARGETS")$gene_symbol, kmeansrows_number = 1)
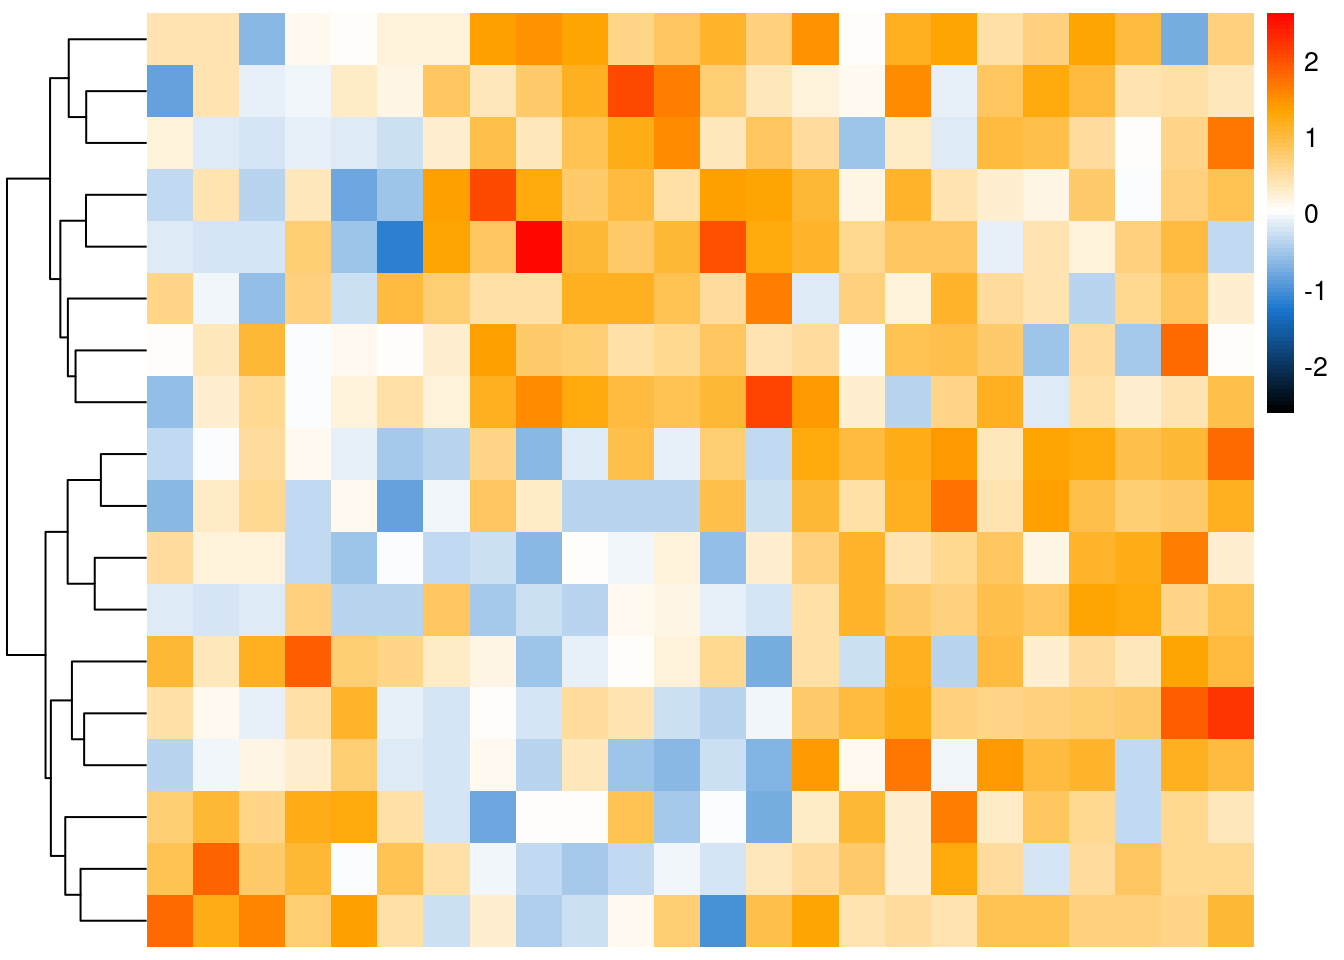
pheatmap
col.pan <- colorRampPalette(c("black", "dodgerblue3", "white", "orange", "red"))(100)

pheatmap::pheatmap(mat, col = col.pan, cluster_rows = TRUE, cluster_cols = FALSE, show_rownames = TRUE, show_colnames = T,  border_color = FALSE, legend = T, fontsize_row = 7, treeheight_col = 20, breaks = seq(-color_bar_range, color_bar_range, length.out = 100), clustering_distance_rows = "euclidean", clustering_method = "complete")
example function
make_heatmap_symbol <- function(genes_input, turnon_rownames = FALSE, rownames_size = 7, turnon_clusterrows = TRUE) {
  # only get the genes that interesct between genes_input and the genes in the normalised matrix
  genes_input <- intersect(genes_input, rownames(norm_mat_DOXvsDMSO_symbol))
  # select out the matrix with only the genes of interest
  heatmap_mat <- norm_mat_DOXvsDMSO_symbol[genes_input, ]
  # generate z-score
  scaled.mat <- t(scale(t(heatmap_mat)))
  ##### ----------------------------------------------------------------------------------------------------
  # annotate column
  columnfactor <- sample_information_DOXvsDMSO$knockout_clone_treatment
  annotation_column <- data.frame(row.names = colnames(scaled.mat), group = columnfactor)
  ##### ----------------------------------------------------------------------------------------------------
  # colors
  # cell colors
  # col.pan <- colorRampPalette(c("purple","black", "yellow"))(100)
  col.pan <- colorRampPalette(c("black", "dodgerblue3", "white", "orange", "red"))(100)
  # column colors
  column_color <- c(brewer.pal(8, "Paired"), ggsci::pal_simpsons()(4))
  names(column_color) <- unique(annotation_column$group)
  anno_colors <- list(group = column_color)
  ##### ----------------------------------------------------------------------------------------------------
  # color bar range
  # get the maximum + minimum value, make it absolute numbers and get the highest number. Set this as the range
  color_bar_range <- max(abs(min(scaled.mat)), abs(max(scaled.mat)))
  # ceiling rounds up (to integer)
  color_bar_range <- ceiling(color_bar_range)
  ##### ----------------------------------------------------------------------------------------------------
  pheatmap::pheatmap(scaled.mat, col = col.pan, cluster_rows = turnon_clusterrows, cluster_cols = F, show_rownames = turnon_rownames, show_colnames = T, annotation_col = annotation_column, border_color = FALSE, legend = T, fontsize_row = rownames_size, annotation_colors = anno_colors, treeheight_col = 20, breaks = seq(-color_bar_range, color_bar_range, length.out = 100), clustering_distance_rows = "euclidean", clustering_method = "complete")
}